Choose a path
Start with a CI/CD outcome, an incident question, or a rollout for your organization. Pick the one that matches your goal.Measure and fix CI
A 30-day reliability report for a repository, fixes for failing checks, and an agent that keeps pull requests green.Run the CI/CD demo →
Investigate an incident
Paste an alert or describe what is wrong. OpenSRE reads logs, metrics and deploys from your connected tools and answers in plain English.Run the quickstart →
Roll it out to your team
One account for the organization and a managed gateway that keeps running repairs after the laptop closes. Slack and other integrations are configured on each engineer’s machine.Review the enterprise setup →
Start with a surface
The sameopensre binary runs everywhere. Pick a surface, install it, and start your first session.
- Interactive shell
- Headless CLI
- Slack
- Managed gateway
Install with one command, sign in, and pick a demo or type a request.Windows uses PowerShell; see Install. The first prompt offers the CI/CD analysis of a repository on your machine, or skip it with E.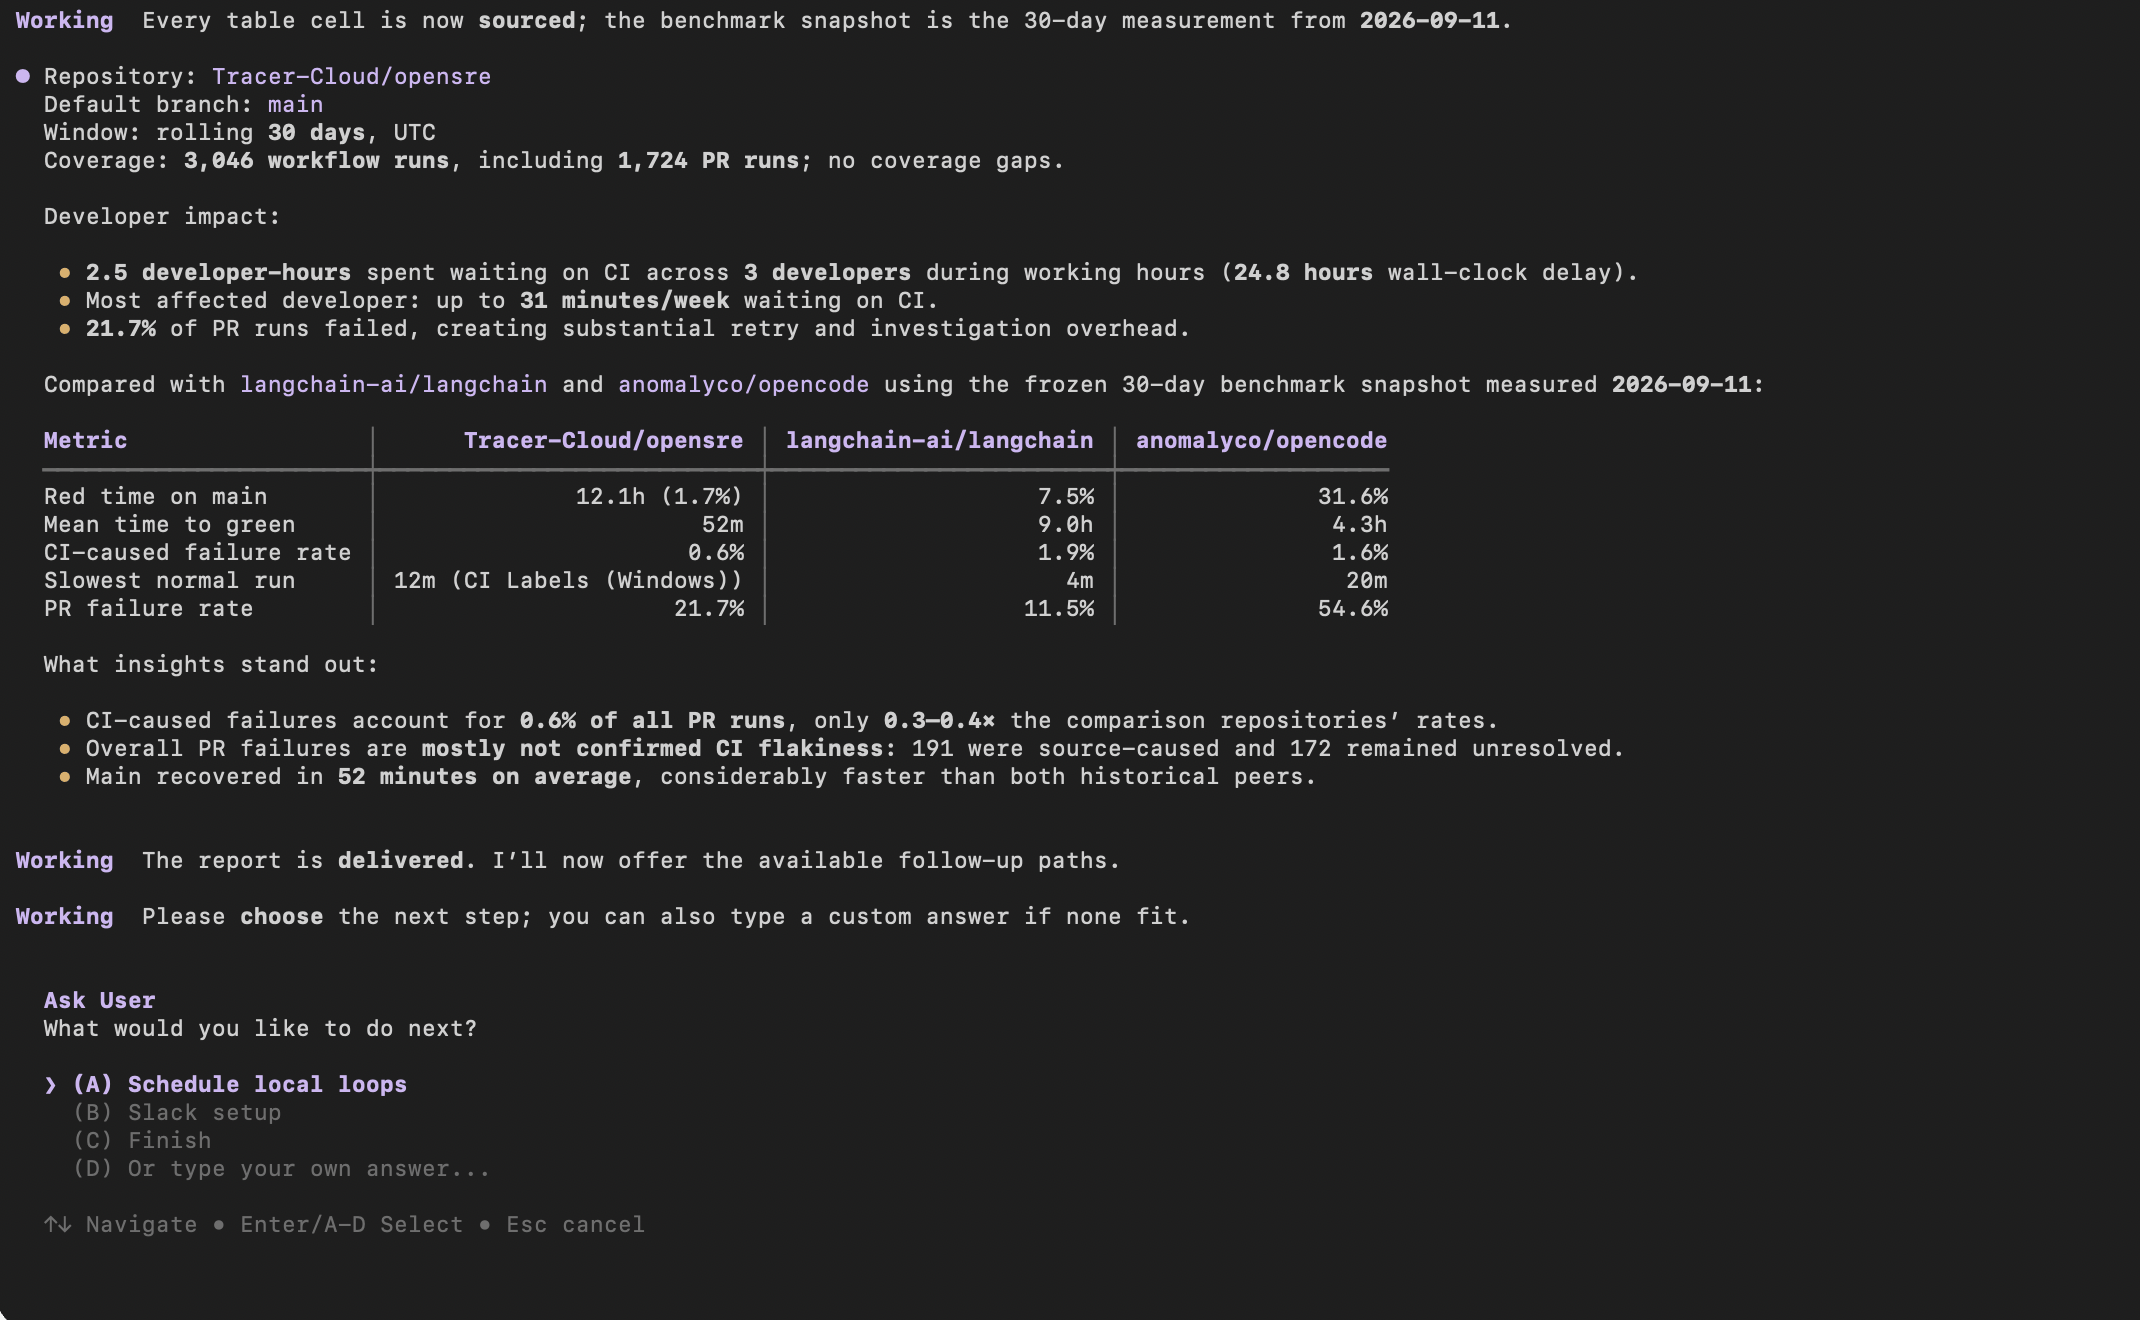
Explore the docs
- Get started: install on macOS, Linux, Windows or Docker, sign in, and the enterprise setup.
- CI/CD: the reliability report, fixing failing checks, the repair agent, and the organization-wide health scan.
- Using the shell: every slash command, how prompts map to tools, and goals that run across turns.
- Run it anywhere: the gateway daemon, headless CLI, HTTP and Python APIs, and the managed gateway.
- Platform: LLM providers, masking, sessions, memory, scheduled loops, and closed-loop learning.
- Integrations: 60+ tools across monitoring, incidents, cloud, code, chat, databases and workflows.
- Community: the showcase giveaway and the pull request review flow.
How a turn runs
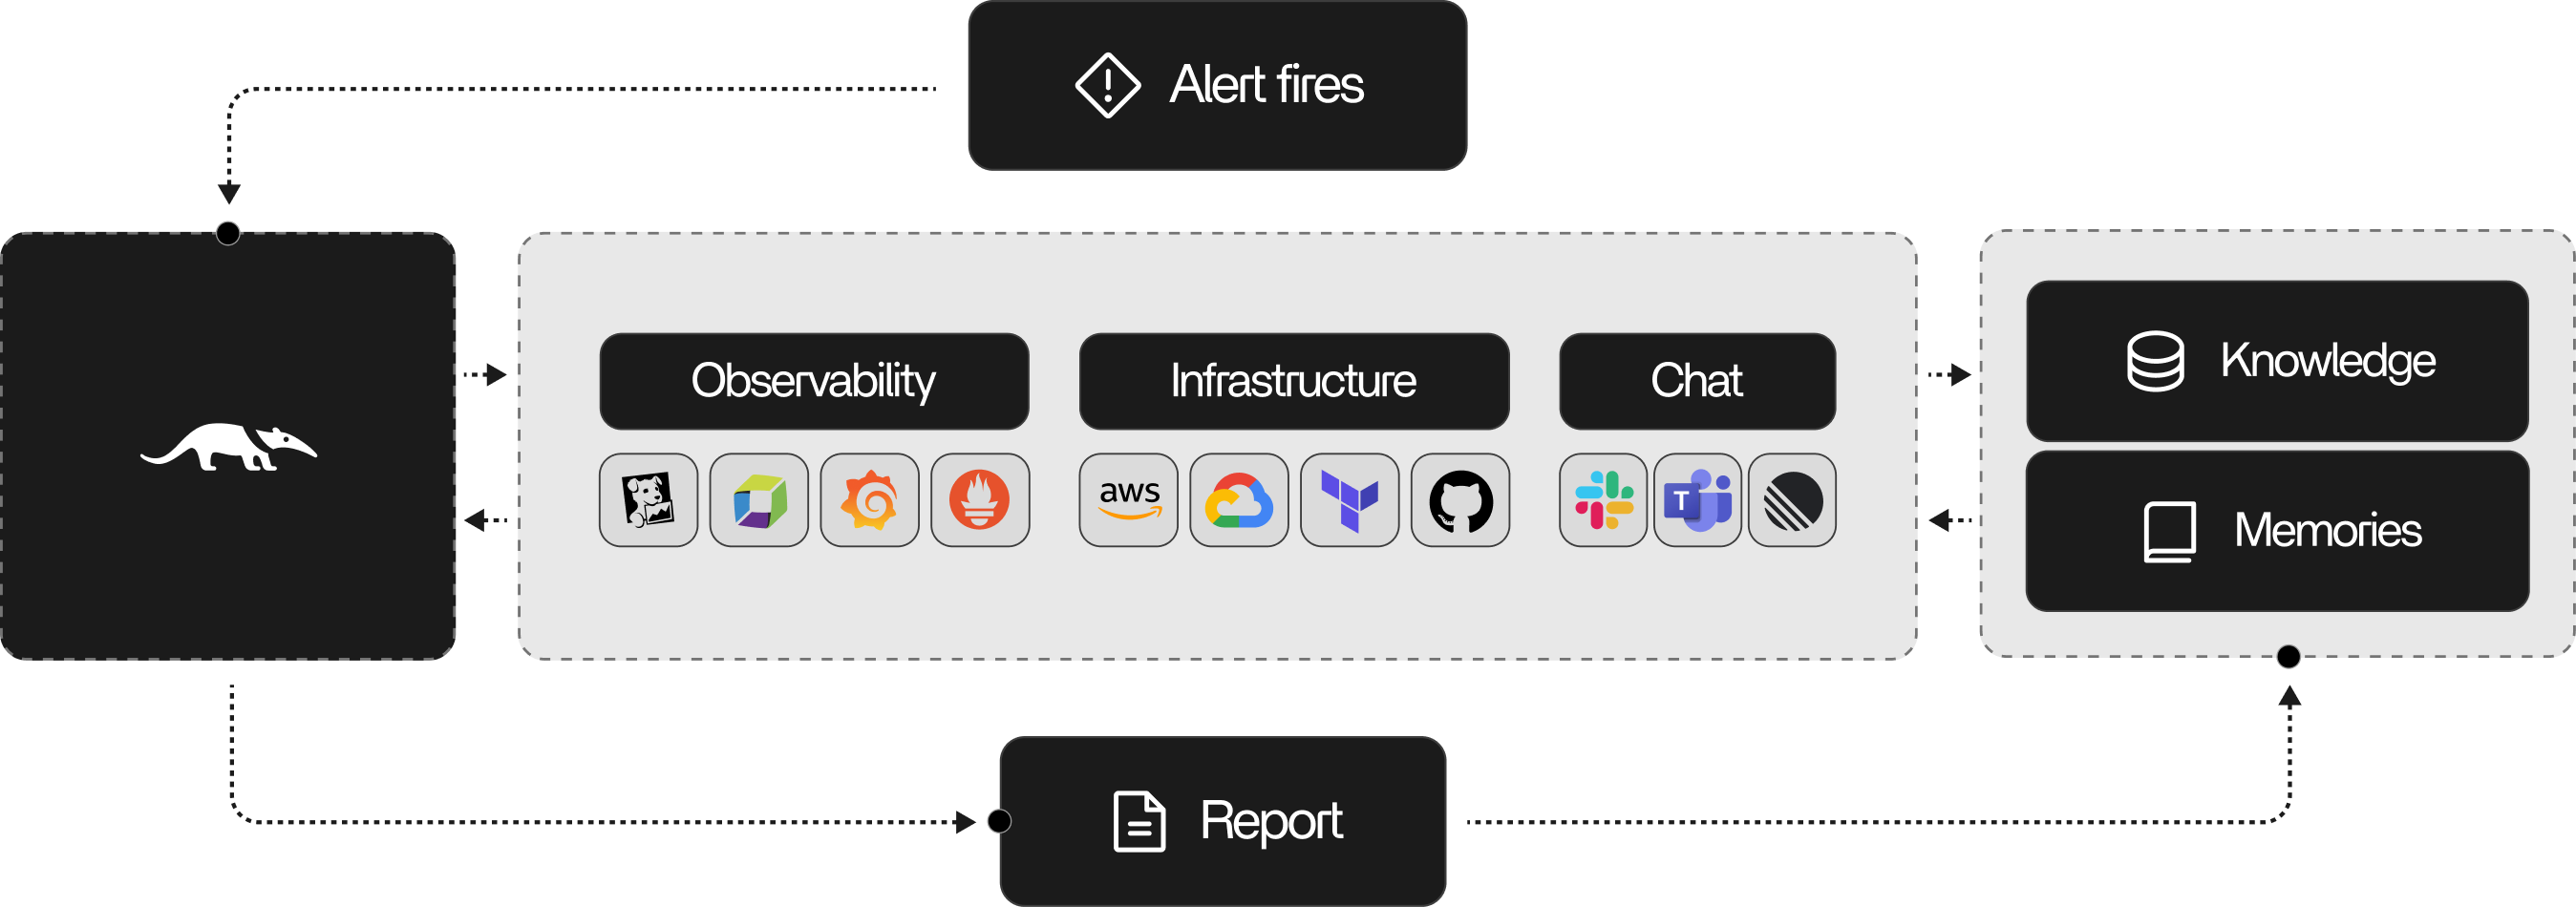
Say an alert fires and you paste it in:- OpenSRE reads the alert and decides what kind of problem it is looking at.
- It gathers context: who owns the service, what changed recently, what is normal.
- It checks the tools you connected for logs, metrics and traces.
- It keeps digging and testing ideas until it can answer.
- It answers in the shell and sends the result where you asked: Slack, Telegram, a file.
Agent workflow