

opensre onboard or opensre integrations setup).
Start an investigation
Interactive shell
/investigate opens a picker when you’re on a TTY. Templates include names like generic, datadog, and grafana. Full slash-command list: Shell commands.
CLI
What you get
- A report in the terminal (streams on a TTY when you’re not writing JSON)
- Machine-readable JSON with
-o ./rca.json(report, problem framing, root cause, and related fields) - In the shell after a run:
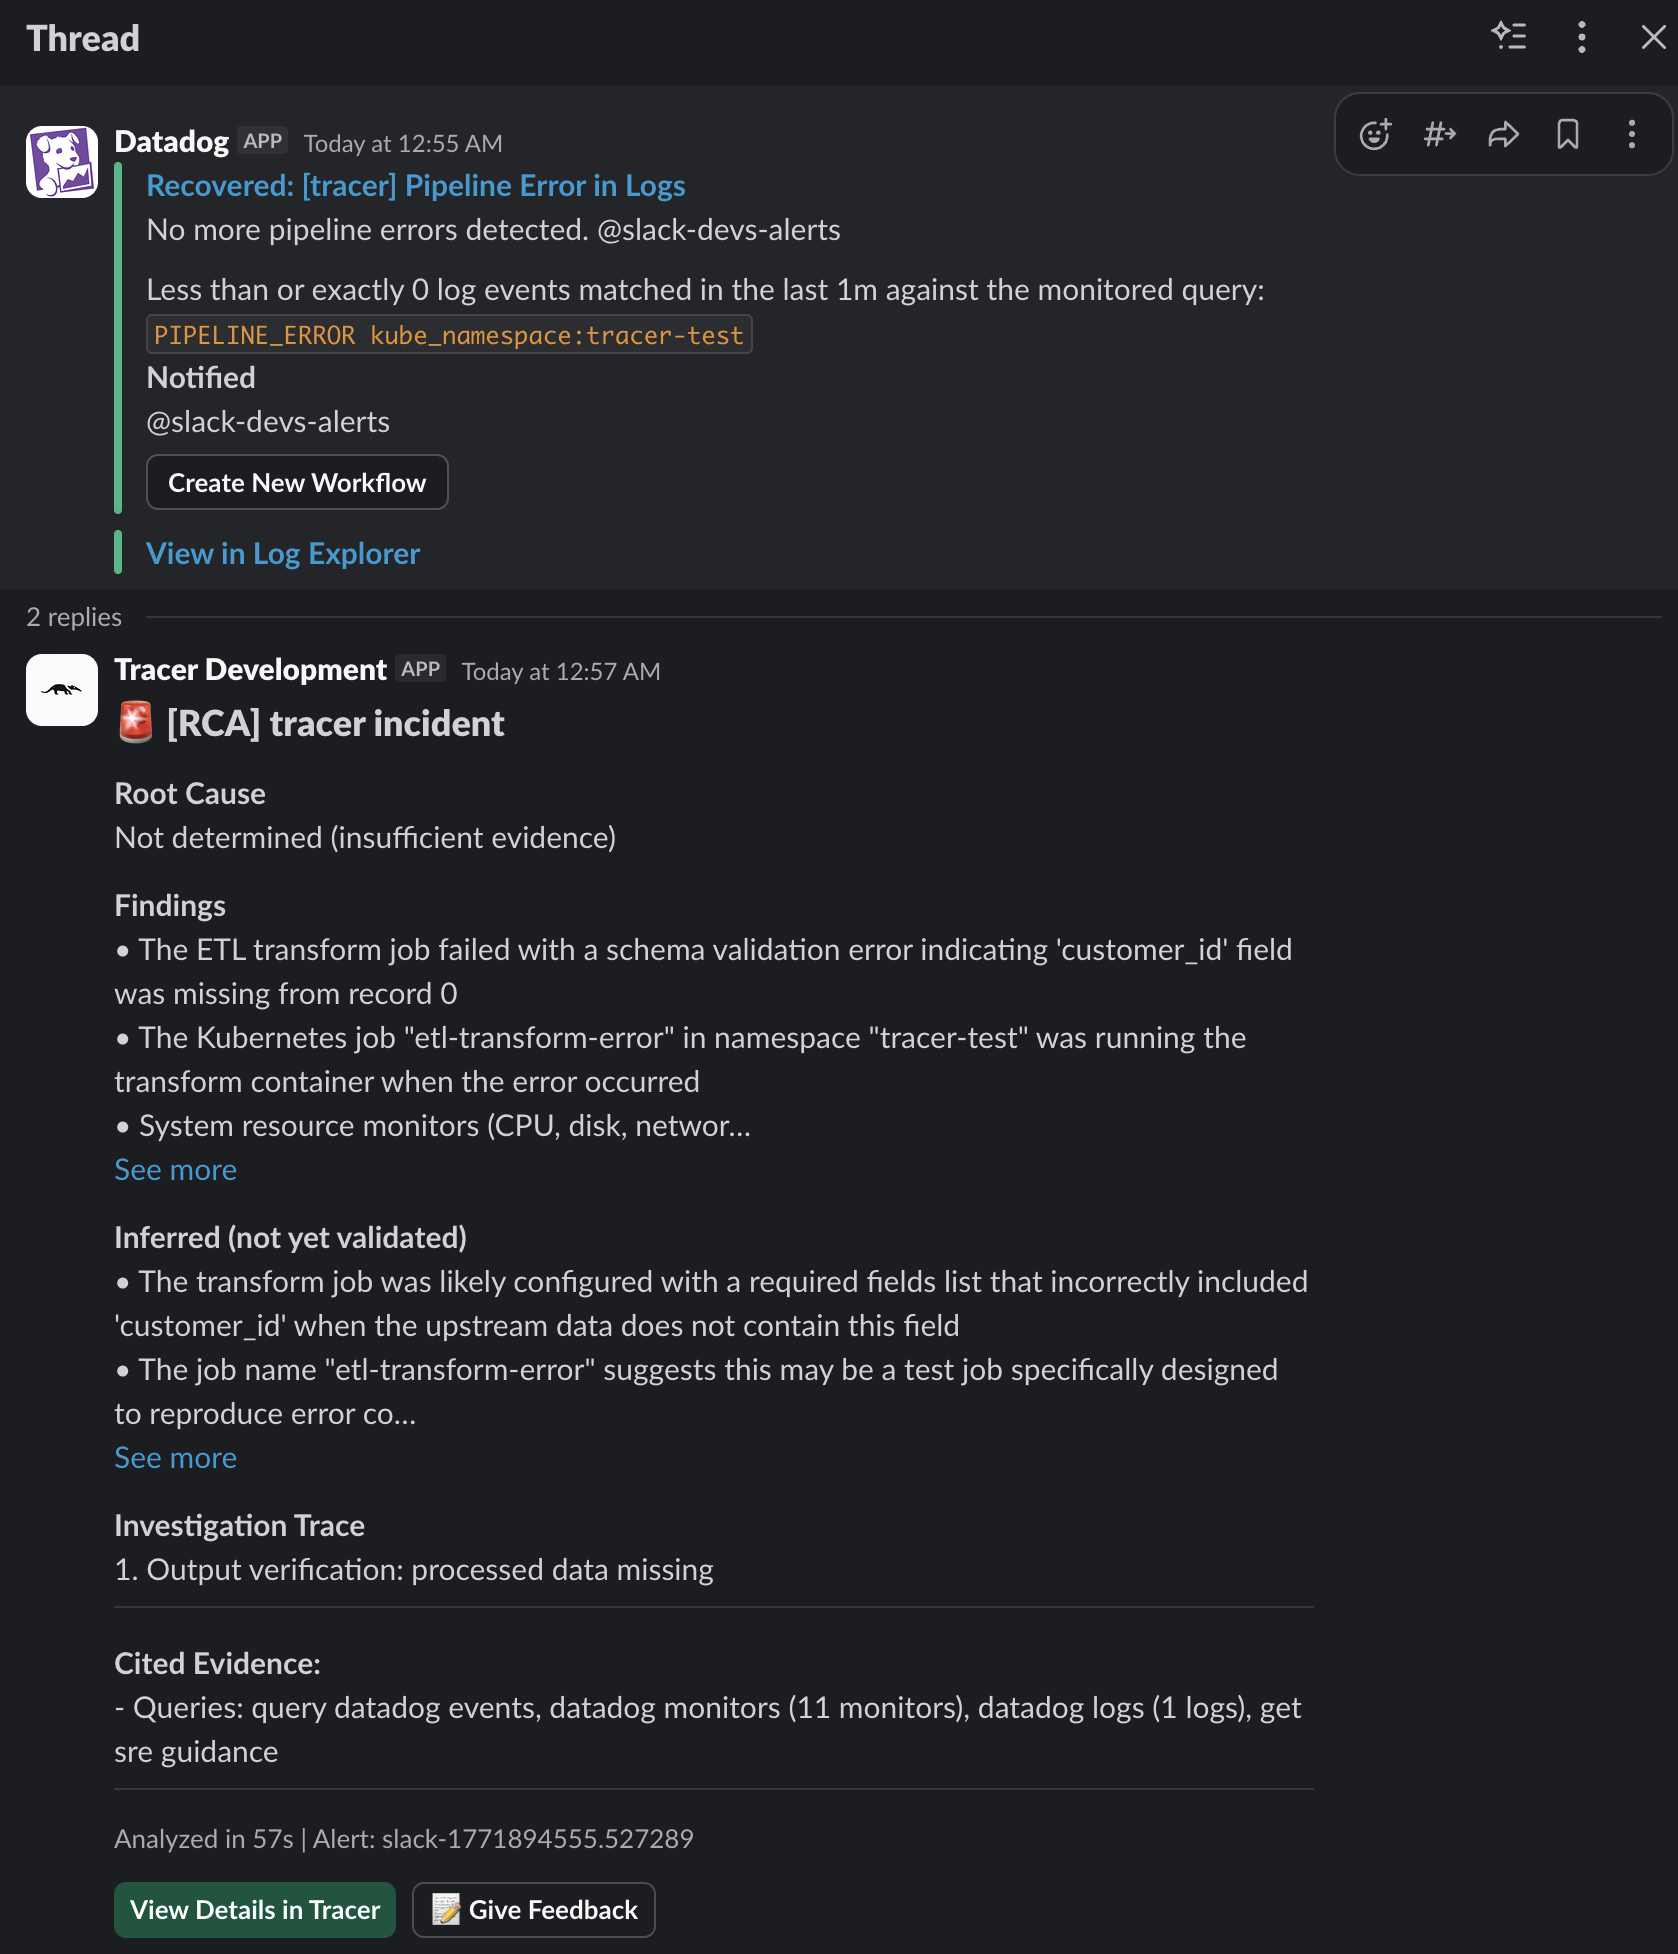
/lastto show it again,/save report.mdor/save rca.jsonto write a file - A short summary to Slack, Telegram, or other chat tools if messaging is configured
Background runs
In the shell, run/background on, then start an investigation. The run continues without blocking the prompt. This is per session only.