Overview
OpenSRE queries Grafana (Cloud or self-hosted) for logs, metrics, traces, alert rules, and annotations during investigations. For a local Minikube lab with Prometheus and a sample app, see Extras.Prerequisites
- Grafana instance URL (Cloud stack URL or self-hosted origin)
- Service account token with read access — see Credentials
Setup
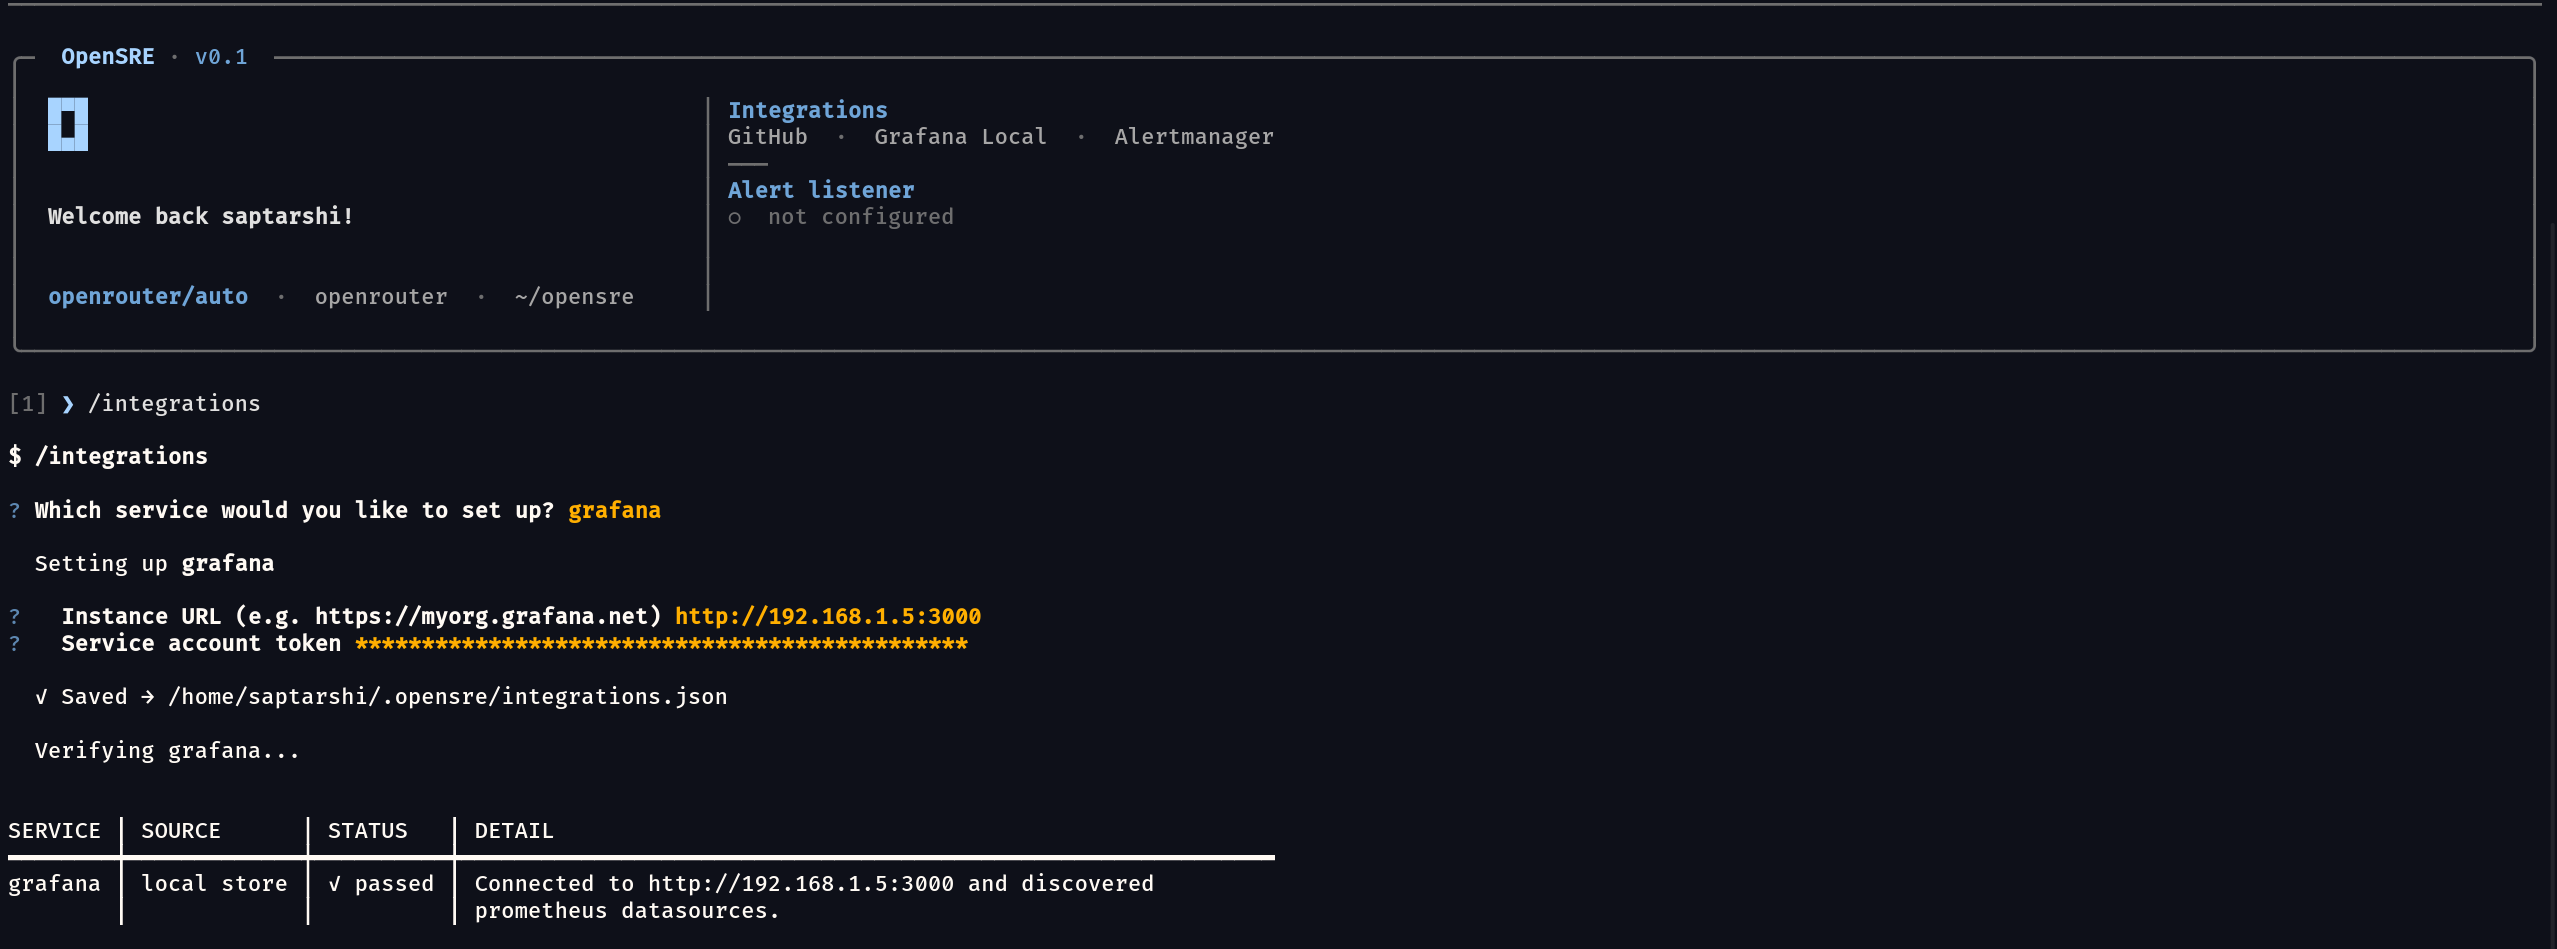
Option 1: Interactive CLI
Option 2: Environment variables
For prod/staging pairs, use
GRAFANA_INSTANCES — see Multi-instance integrations.
Option 3: Persistent store
Option 4: Hosted web app (OpenSRE Cloud)
Hosted OpenSRE Cloud is coming soon. Until then, use the local CLI, environment variables, or persistent store above.
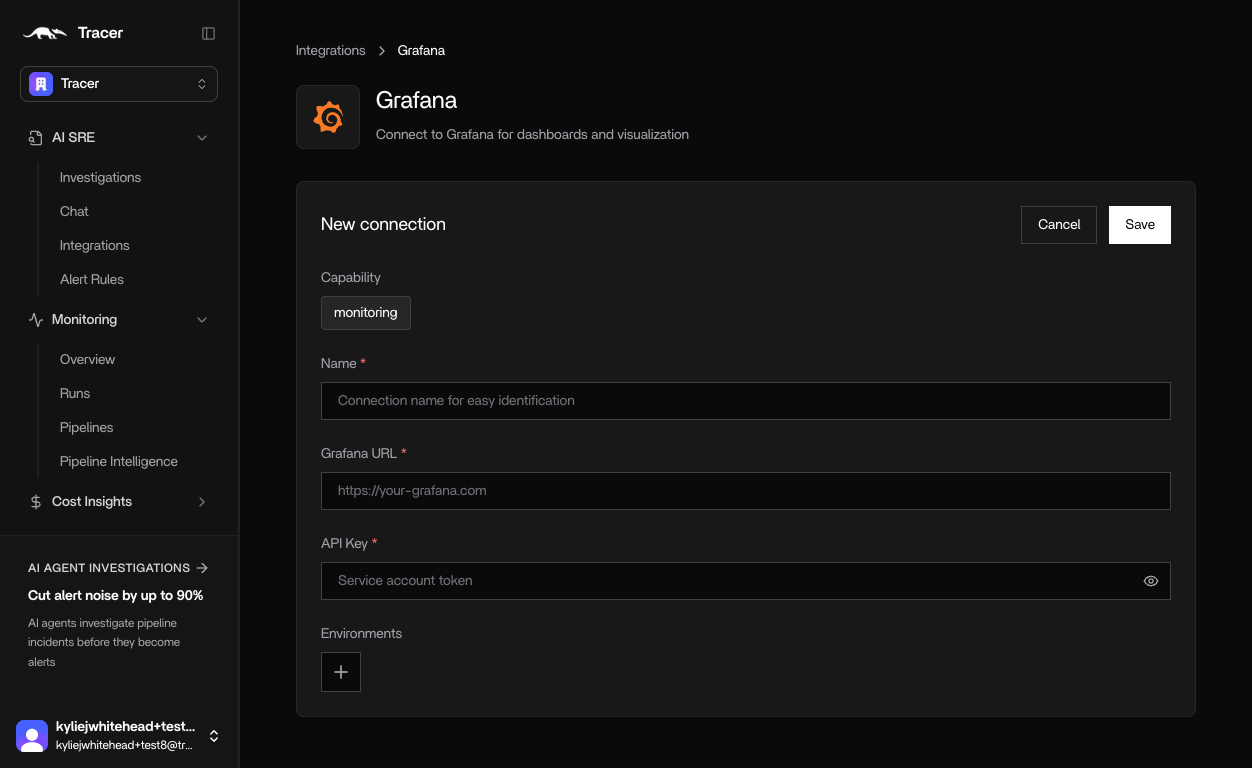
- In app.tracer.cloud, go to Integrations → Grafana
- Enter a name, instance URL, and service account token
- Click Save
Self-signed or internal CA certificates
If Grafana uses a certificate signed by an internal CA,opensre onboard prompts for:
You can also set these in
.env:
Credentials
Create a Grafana service account token with read access. See Grafana service account tokens.- In Grafana, open Administration → Service accounts (or your stack’s equivalent).
- Create a service account with read access to the datasources you want OpenSRE to query.
- Add a token to that service account and copy it (shown once).
GRAFANA_READ_TOKEN (CLI prompt: service account token).
Investigation tools
Deployment and config-change markers are covered on Grafana Annotations. To push investigation reports into Loki/annotations, see Grafana Log Sink. For standalone Tempo (no Grafana proxy), see Grafana Tempo.
Verify
Troubleshooting
Security
- Prefer a dedicated service account token with read-only access for investigations.
- Prefer
GRAFANA_CA_BUNDLEover disabling TLS verification for real internal Grafana. - Set
GRAFANA_VERIFY_SSL=falseonly for local/lab instances. - Store tokens in
.envor your secret manager — not in source control.
Extras
Local Grafana setup (Minikube example)
Use this lab to run Grafana, Prometheus, and a sample app locally, then connect OpenSRE.Steps
-
Start Minikube:
-
Add Helm repositories and update:
-
Install the kube-prometheus stack:
-
Install the podinfo sample app:
-
(Optional) Check pods:
-
Port-forward podinfo (separate terminal):
-
Port-forward Prometheus (separate terminal):
-
Port-forward Grafana on all interfaces (separate terminal):
-
Allow Prometheus to scrape podinfo ServiceMonitors:
Grafana credentials
Get the admin password:admin; password is the command output.
Access
Simulate load
Sample Grafana queries
Request rate by status: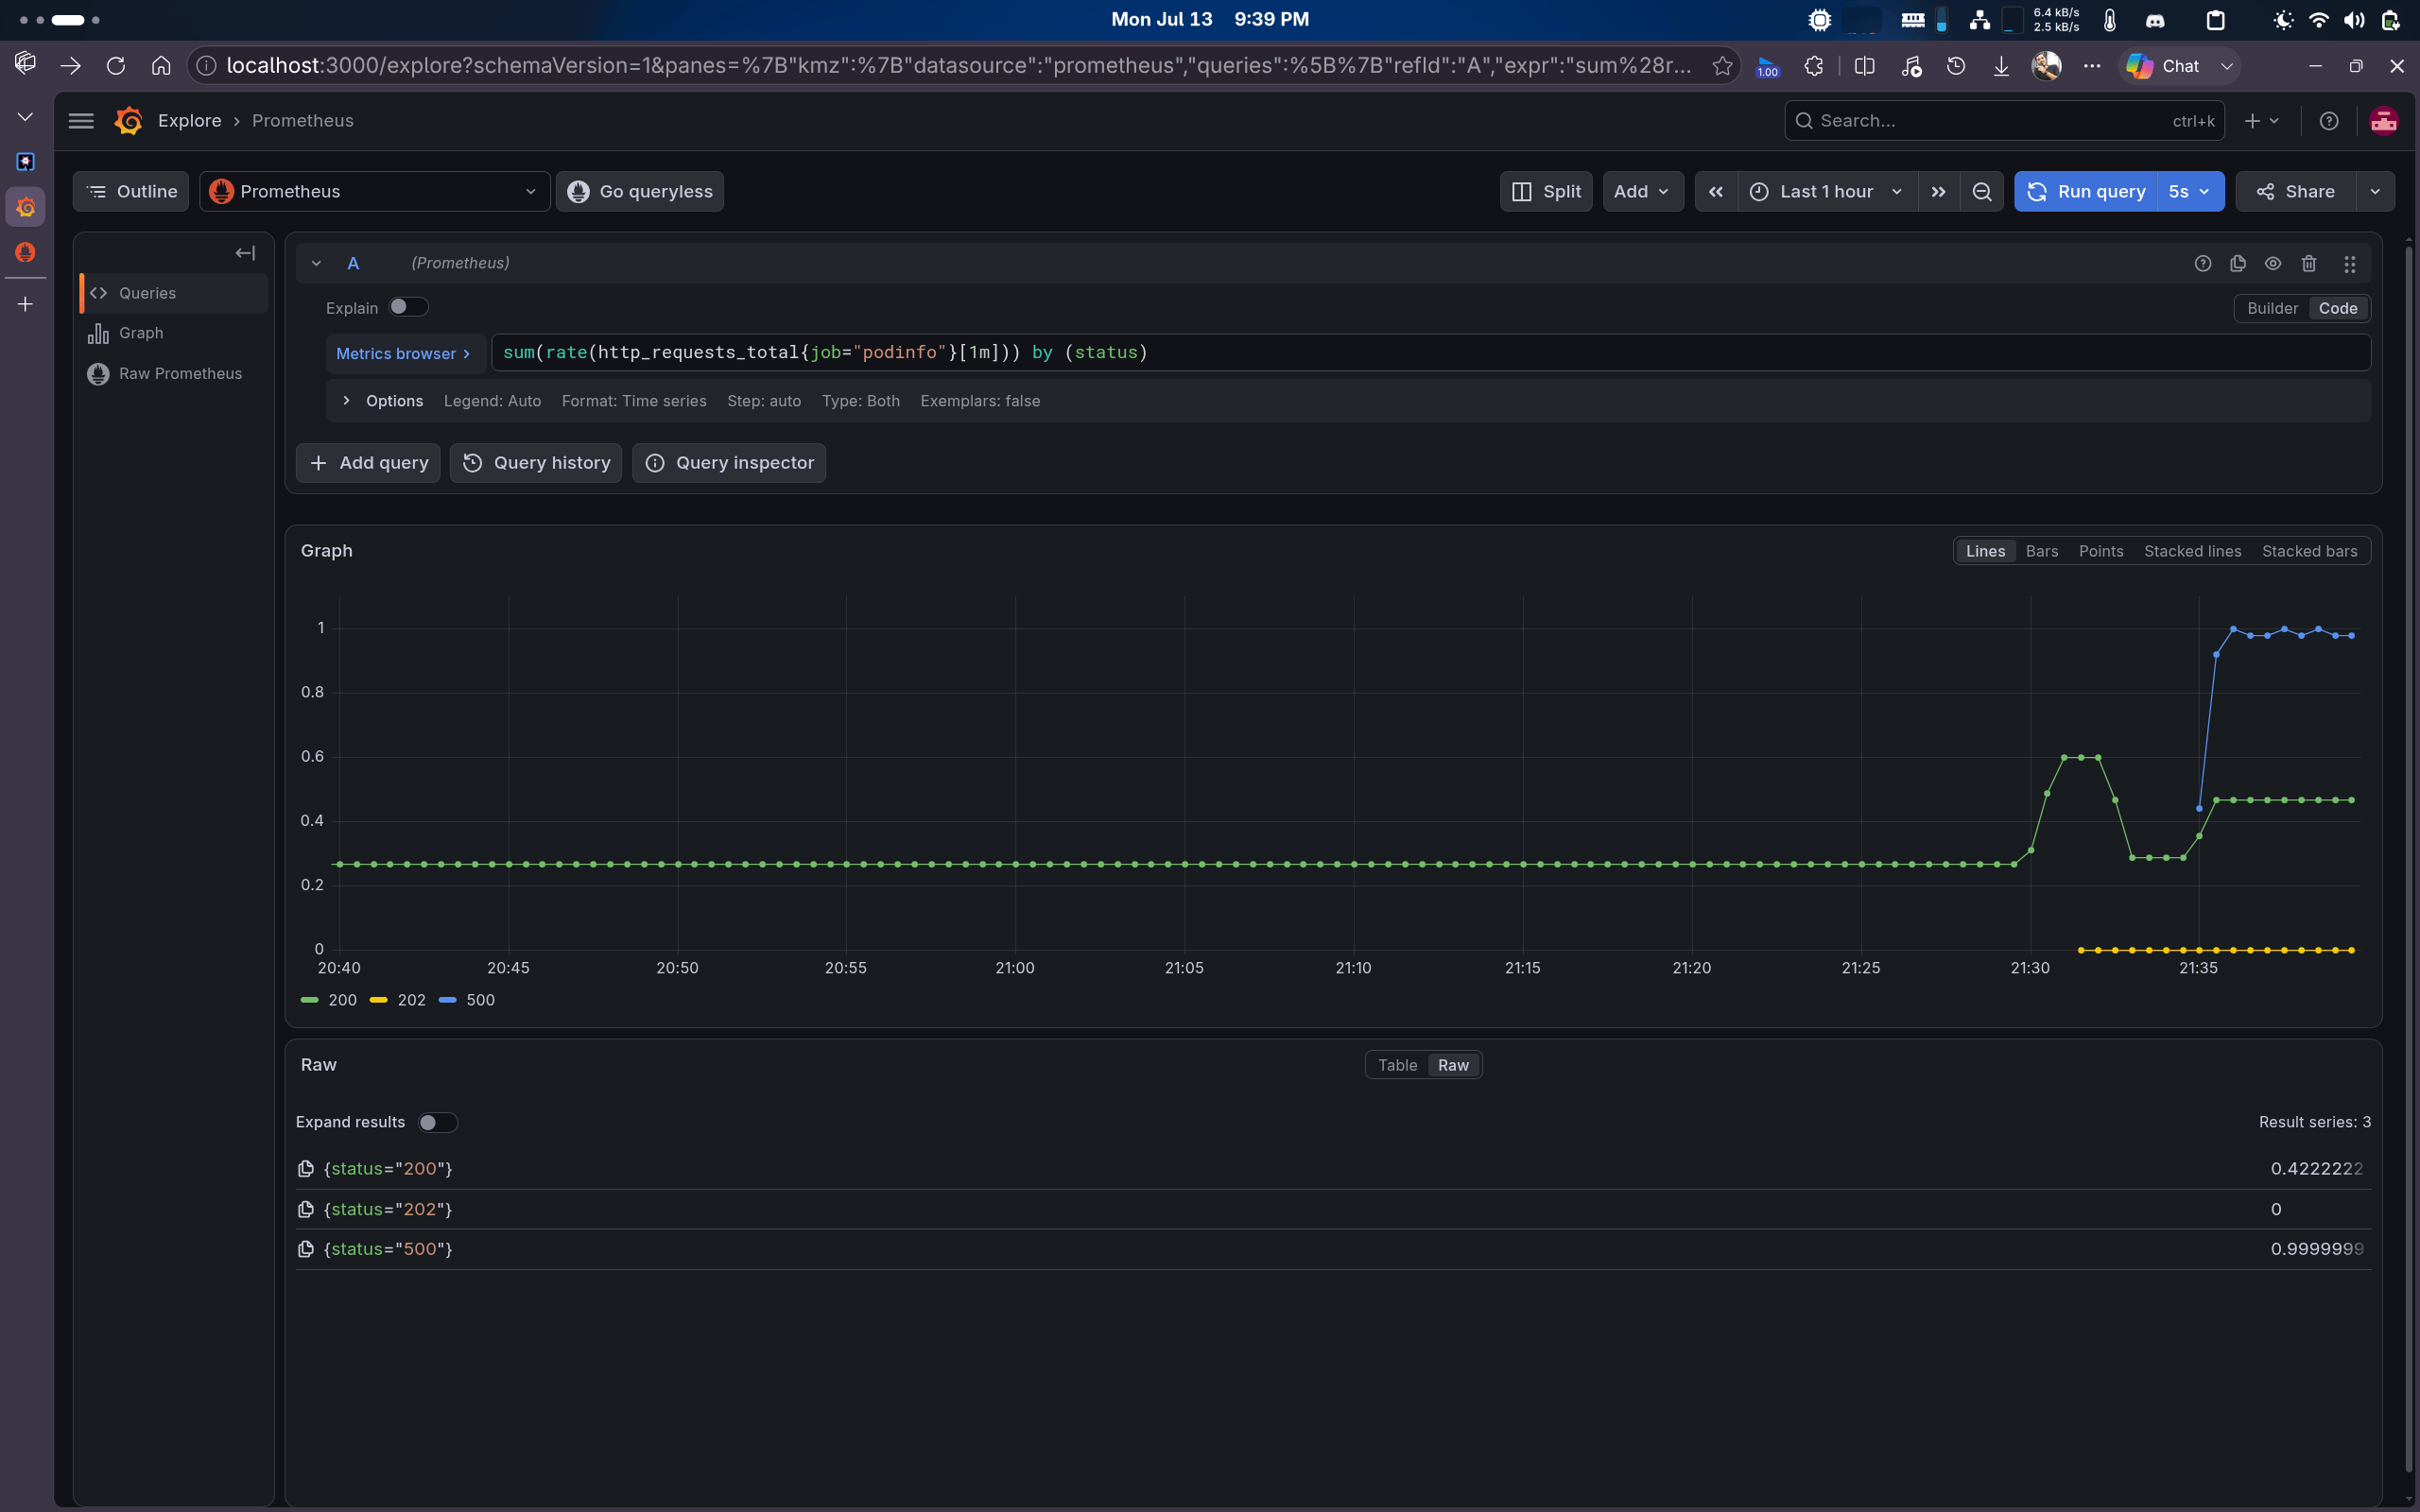
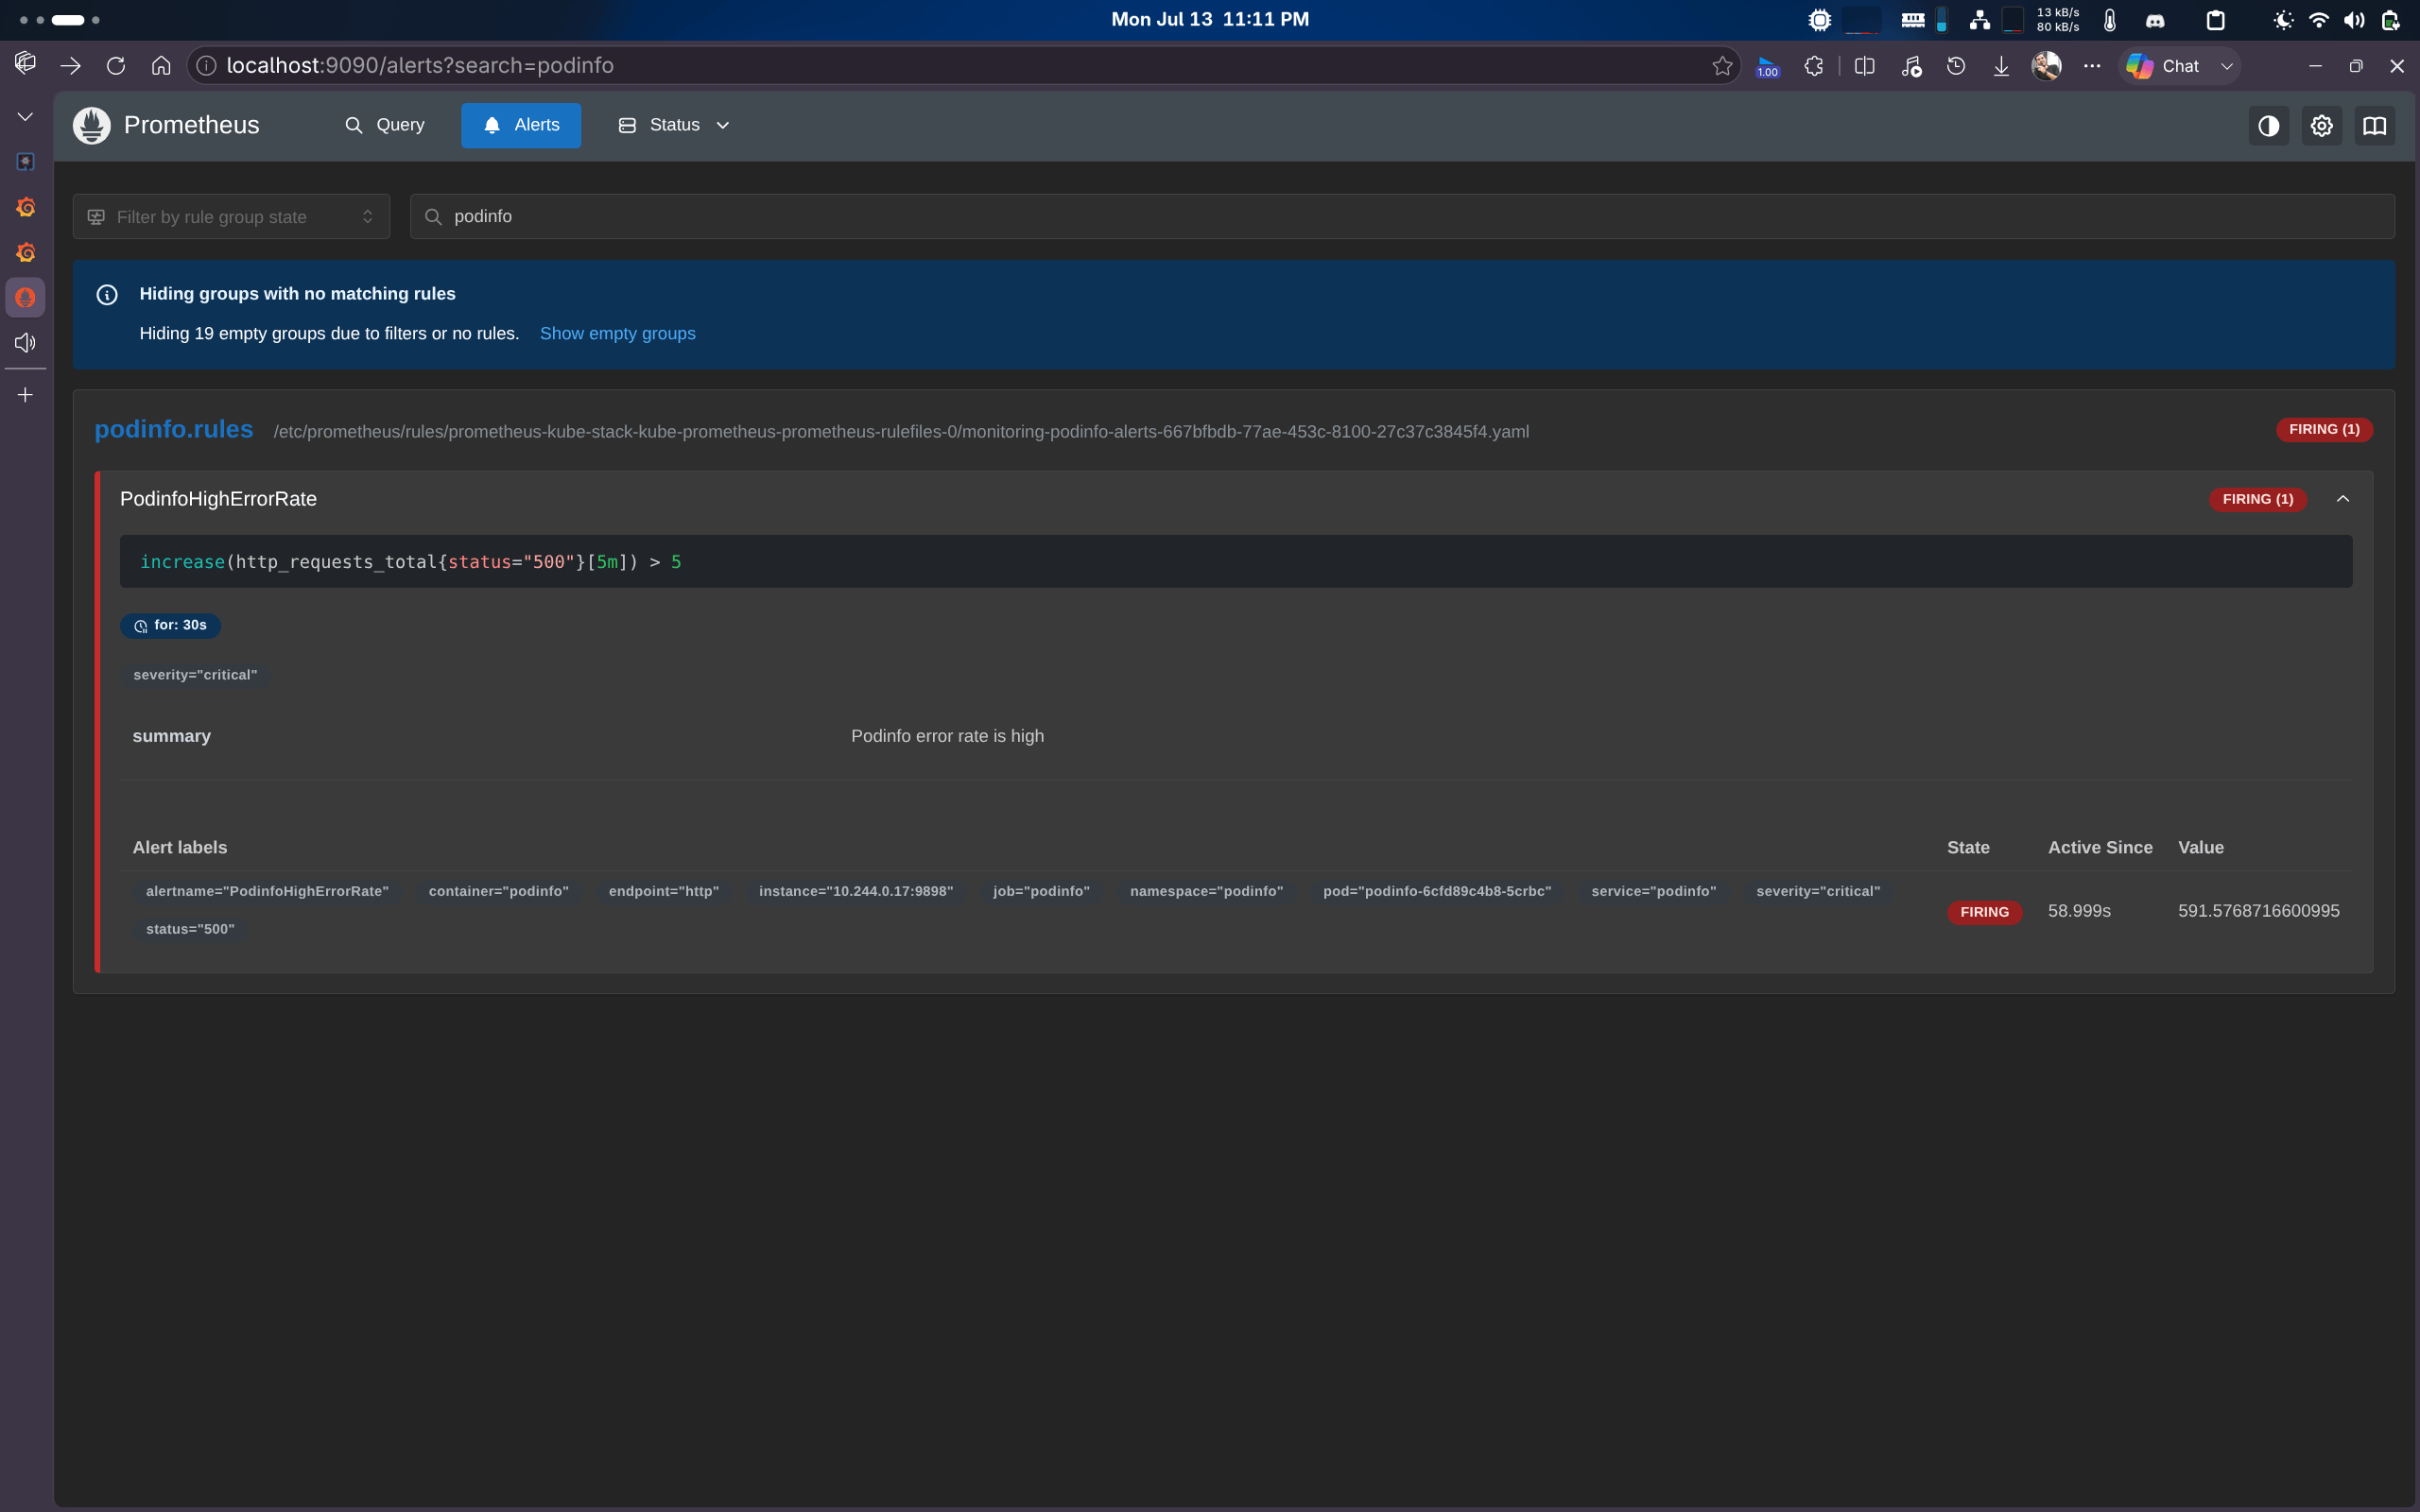
Prometheus alert for high error rate
Connect OpenSRE to the lab Grafana
-
Get your machine’s LAN IP:
- Create a Grafana service account token (Grafana docs).
-
Run setup and enter:
For local/lab TLS issues, set
GRAFANA_VERIFY_SSL=falseor answer the SSL prompts as described in Setup.