

1) Create your organization account
Sign up at opensre.com and continue in app.tracer.cloud/sign-up to create or join your organization workspace.2) Complete workspace onboarding
In the web app, complete onboarding to:- Define your workspace context (team name, default channels)
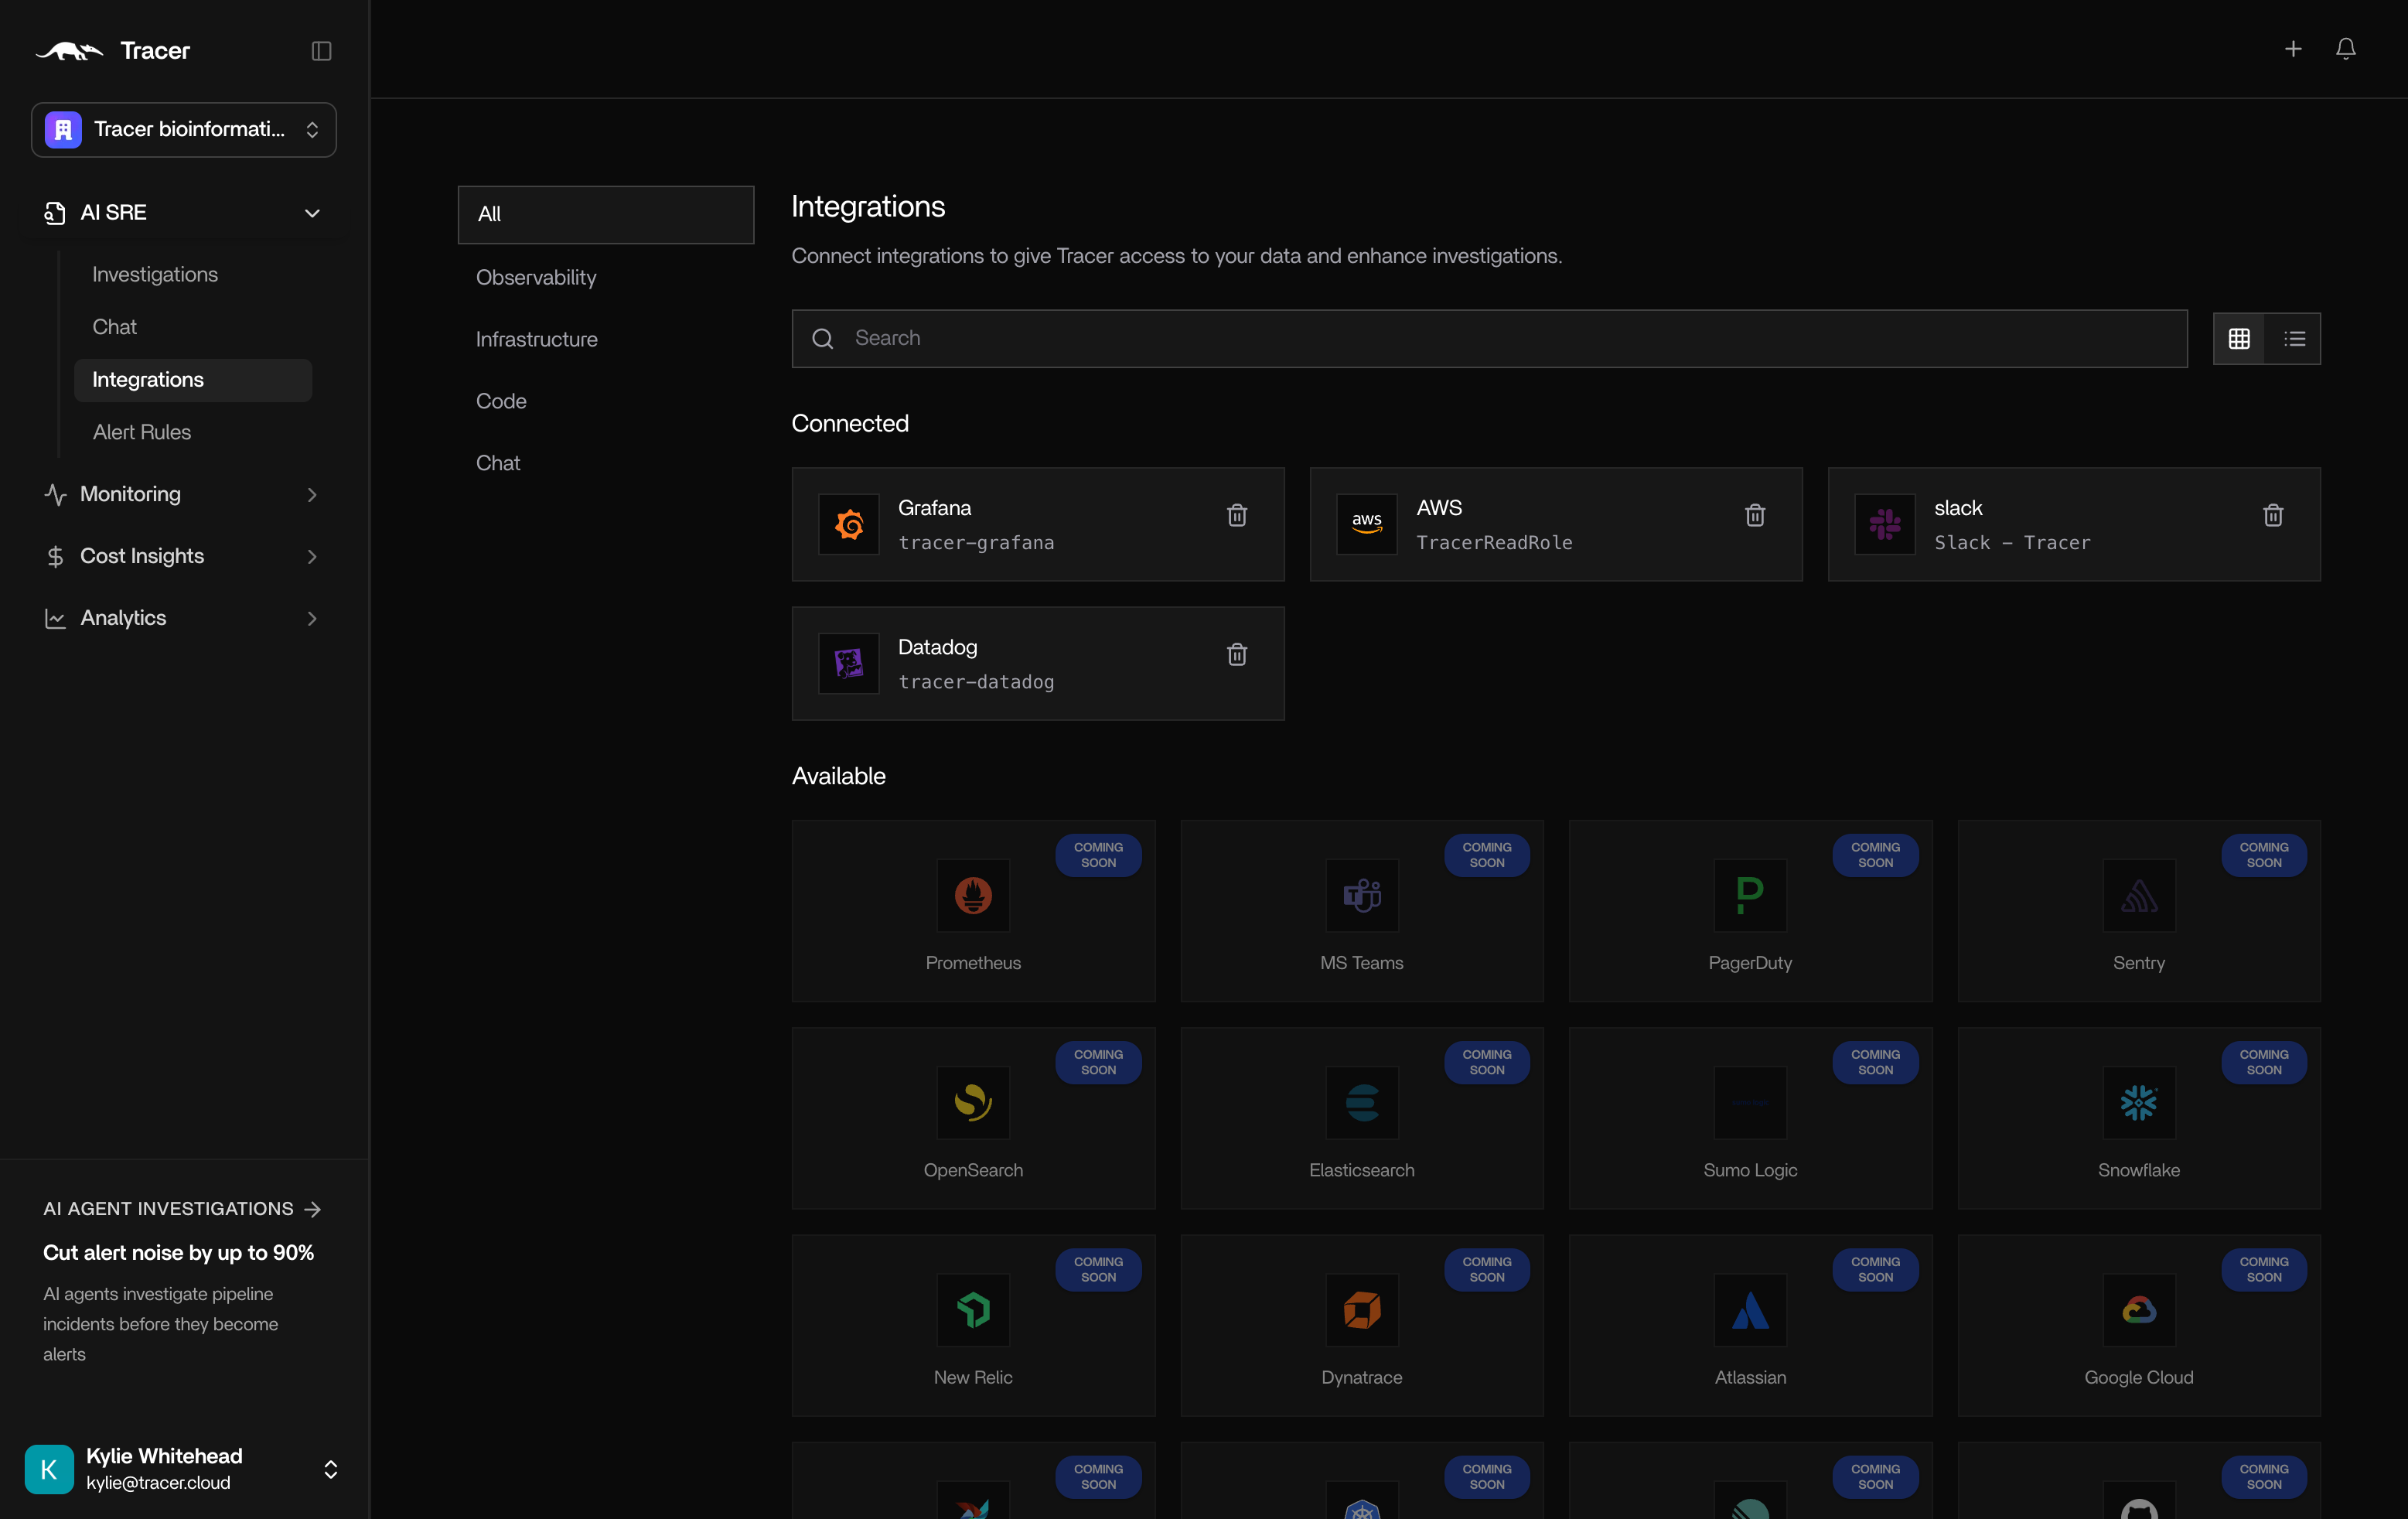
- Connect your first integrations (start with observability + messaging)
- Verify access and permissions for each connector
3) Configure integrations for your org
Enterprise integrations are configured in the web app and shared across your organization. Use the integration catalog for credential requirements:- Integrations overview — local CLI and hosted setup paths
- Datadog — API key + application key (hosted flow in Option 3)
- Grafana — service account token + endpoint URL
- AWS — cross-cloud infrastructure mapping
- Slack — chat with OpenSRE from your channels
Verification checklist
After connecting each integration in the web app:- Confirm the connector shows connected in Integrations
- Ask OpenSRE a test question that uses the connector (e.g. what alerts fired in the last hour?)
- Confirm the answer arrives in your configured Slack channel (see Slack setup)